

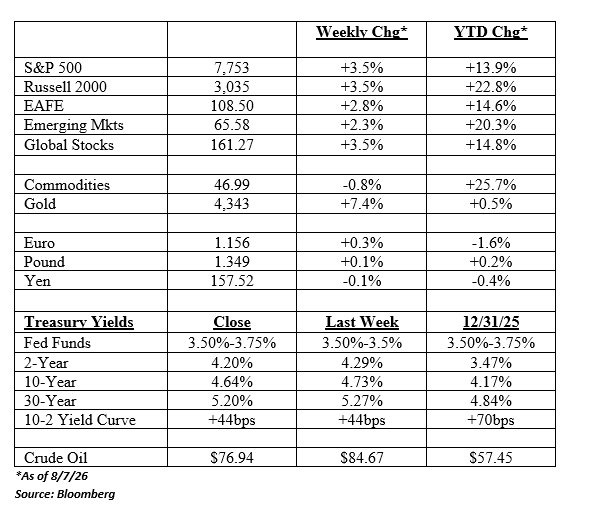
On Thursday, Fed Chairman Kevin Warsh was, as they say, on the horns of a dilemma. Should he continue to talk tough on inflation at the Jackson Hole conflab on August 27th, possibly signaling a rate hike in September, or talk about AI and productivity fairies leading to a much more dovish outcome? Maybe both? Or, as seems to be his inclination, say nothing meaningful at all?
Well, by Friday morning his job got a whole lot easier. Hiring rolled over in July, and prior months were marked down rather significantly. 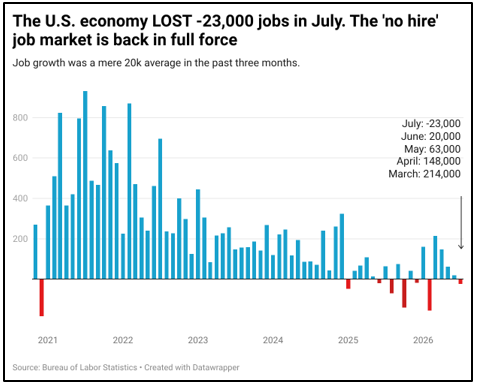
This isn’t an ‘end of the world’ recessionary report by any stretch, but a contraction is a contraction, and it gives Warsh an out when talking about policy for at least a couple months.
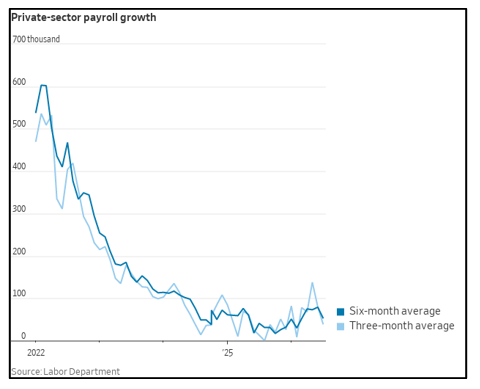
Why didn’t the market interpret this as a dire shot across the bow? Well, as in all payroll reports, there’s a lot of noise. For example, private-sector hiring was +30,000 in July – losses were centered in public education. But this isn’t to say private-sector hiring was booming by any stretch, as you can see below.
Also letting Warsh off the hook is the fact that payroll growth slowed again in July, hitting the lowest level since 2017. 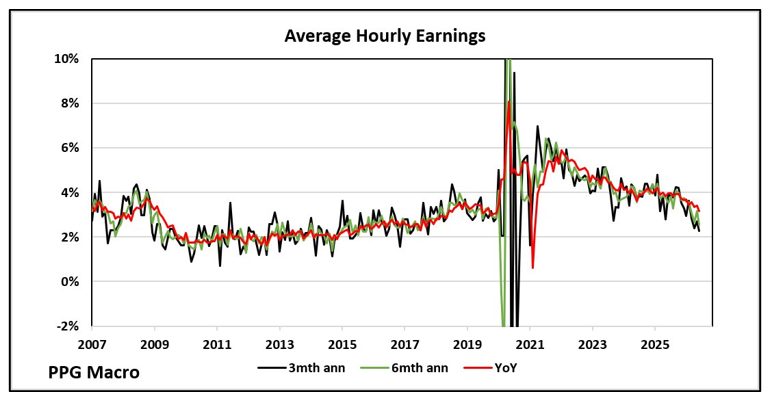
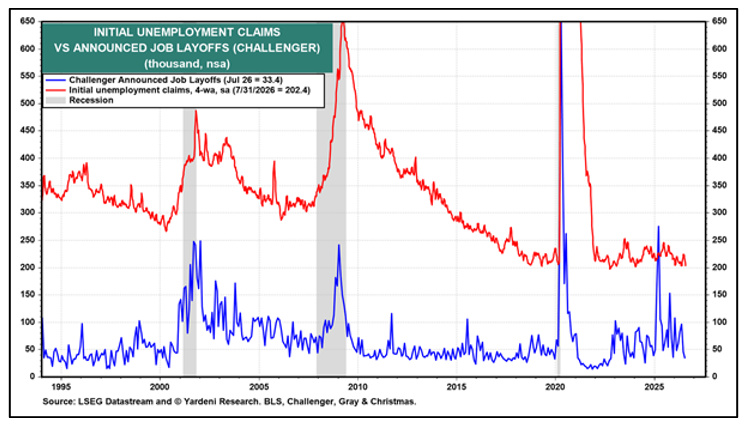
For the equity markets in particular, this was a goldilocks type report. The modest contraction in hiring combined with slower payroll growth means the Fed can take a wait-and-see approach. But underneath the surface it’s pretty clear the wheels aren’t coming off the economy. As Ed Yardeni noted on Friday: “The decline in jobless claims is corroborated by layoff announcements. US employers announced just 33,429 job cuts in July, the lowest monthly total in two years.”
The market has a rate hike at the September meeting as basically a coin flip.
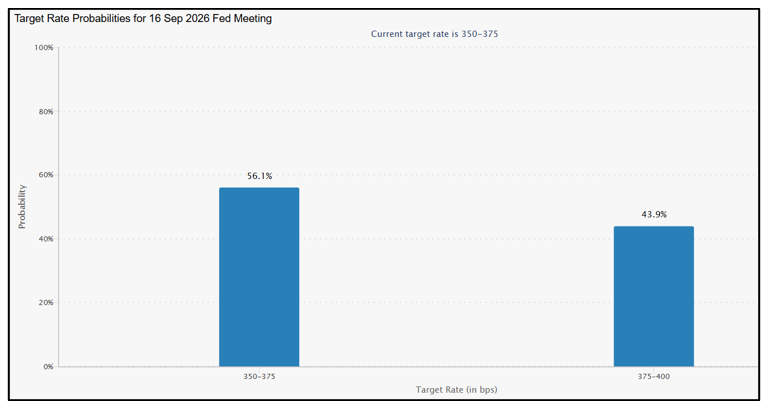
Next week we get a new CPI report, and even if it comes in hot, the committee is going to be torn between their dual mandate, which means there’s a non-negligible chance they choose to punt on doing anything until (probably) after the mid-terms. Time will tell, but Warsh’s comments at Jackson Hole in a few weeks are probably going to be more important than whatever economic data we have between now and then.
He’s going to talk about his task forces, isn’t he?
(Other) Charts We Found Interesting
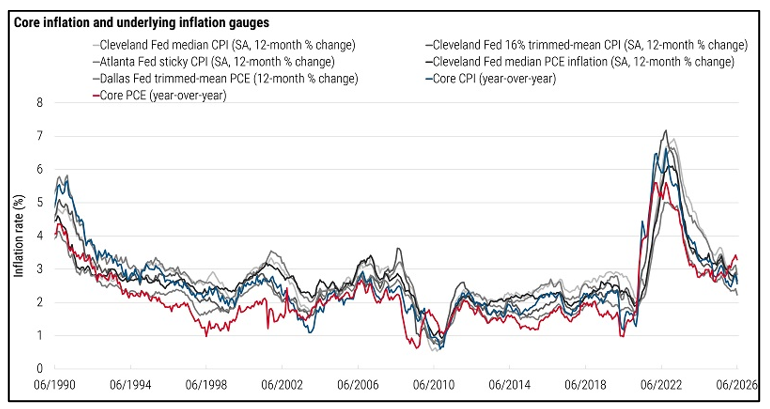
- Warsh might also talk about what’s an appropriate inflation measure to target. The chart below from PIMCO shows an assortment of different methodologies. For years now, the Fed has targeted the Core PCE measure (red line), which has coincidentally been the lowest measure of inflation (surprise surprise!!). But the script has changed recently, and other measures are now coming in below Core PCE. Time to change the yardstick?
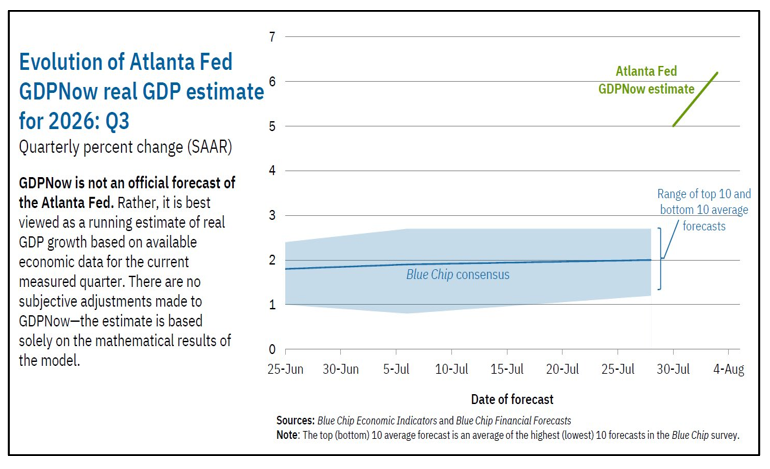
- What’s the counterpoint to the idea of no hike at the September meeting? How about third quarter GDP growth tracking at over 6%!!!
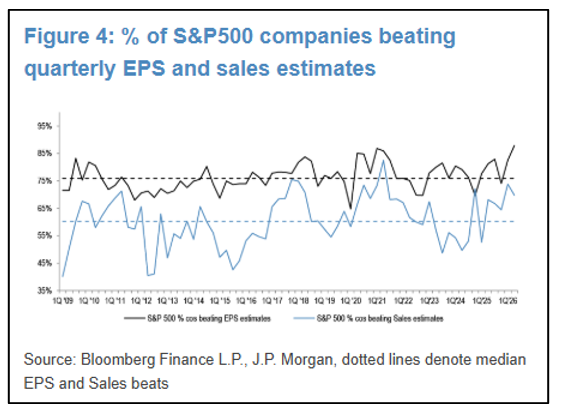
- Earnings season is getting close to being over, and the percentage of S&P 500 companies beating expectations hit unprecedented levels.
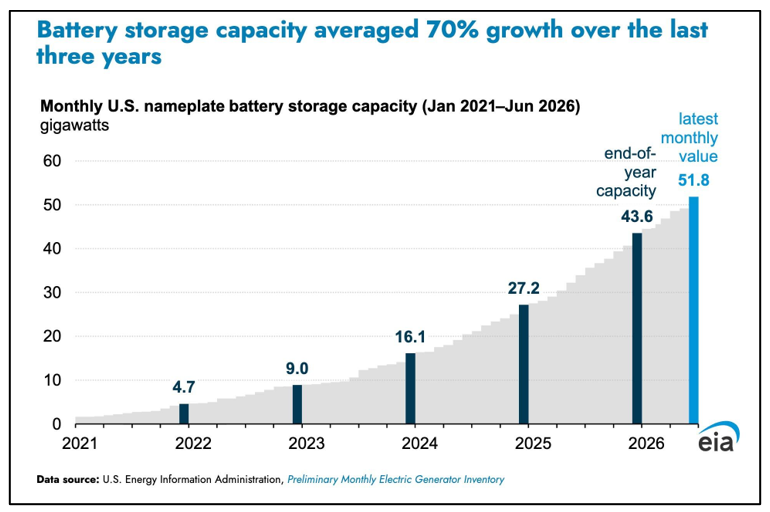
- From Paul Kedrosky – “U.S. adding more grid power storage every month than the annual total before 2022.”
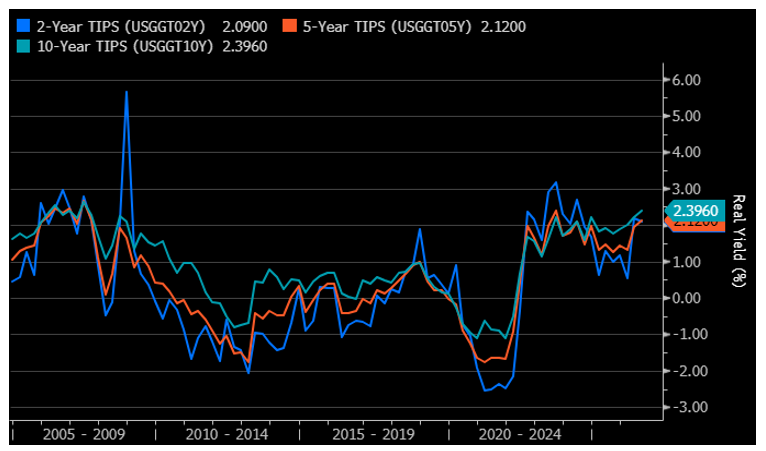
- The yields on Treasury Inflation Protected Securities (TIPS) of various maturities are bouncing around multi-year highs.
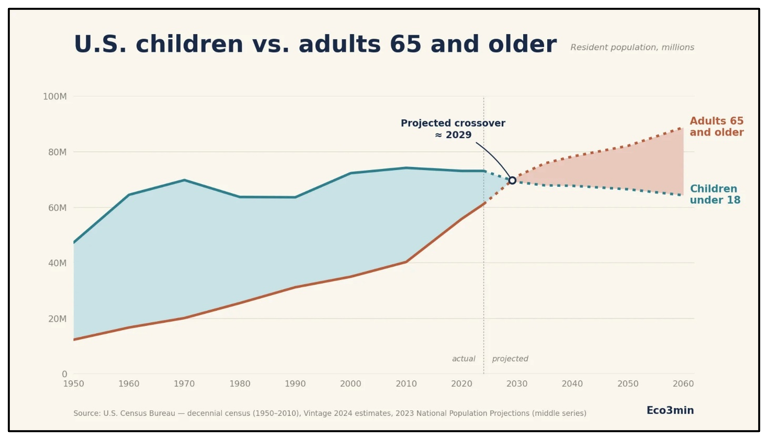
- There’s nothing magical about there being over 65’s than under 18’s, but it is symbolic of global trends.
Have a good weekend
Charles Blankley
Published by Gemmer Asset Management LLC. The material presented (including all charts, graphs and statistics) is based on current public information that we consider reliable, but we do not represent it is accurate or complete, and it should not be relied on as such. The material is not an offer to sell or the solicitation of an offer to buy any security in any jurisdiction where such an offer or solicitation would be illegal. It does not constitute a personal recommendation or take into account the particular investment objective, financial situations, or needs of individual clients. Clients should consider whether any advice or recommendation in this material is suitable for their particular circumstances and, if appropriate, see professional advice, including tax advice. The price and value of investments referred to in this material and the income from them may fluctuate. Past performance is not a guide to future performance, future returns are not guaranteed, and a loss of original capital may occur. Fluctuations in exchange rates could have adverse effects on the value or prices of, or income derive from, certain investments. No part of this material may be (i) copied, photocopied, or duplicated in any form by any means or (ii) redistributed without the prior written consent of Gemmer Asset Management LLC (GAM). Any mutual fund performance presented in this material are used to illustrate opportunities within a diversified portfolio and do not represent the only mutual funds used in actual client portfolios. Any allocation models or statistics in this material are subject to change. GAM may change the funds utilized and/or the percentage weightings due to various circumstances. Please contact GAM, your advisor or financial representative for current inflation on allocation, account minimums and fees. Any major market indexes that are presented are unmanaged indexes or index-based mutual funds commonly used to measure the performance of the US and global stock/bond markets. These indexes have not necessarily been selected to represent an appropriate benchmark for the investment or model portfolio performance, but rather is disclosed to allow for comparison to that of well known, widely recognized indexes. The volatility of all indexes may be materially different from that of client portfolios. This material is presented for informational purposes. We maintain a list of all recommendations made in our allocation models for at least the previous 12 months. If you would like a complete listing of previous and current recommendations, please contact our office.